REPORT DESIGNER
"Report Designer" is a professional tool that allows users to create and preview reports regardless of platform. This feature allows users to design reports the way they want and edit them to suit their needs.
 To create "Report Designer", follow these steps on the IDE:
- The "IDE" opens.
- "PROJECT MANAGER" opens.
- The relevant project is selected and the "SOLUTION ROAM" tab opens.
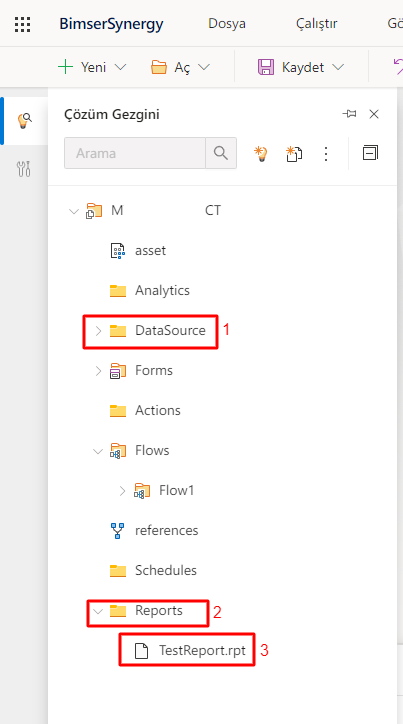
- Right-click on the "REPORTS" folder. The report is generated by pressing the Add button.
Let's create our first report.
"The first band of the report, "Report Header", is located in the margins in off-page regions. This includes the report's name, company logo, creation date, user name, and other important information. In this way, the necessary introduction and information is provided at the beginning of the report.
"Report Footer" appears on the last page of the report before the Page Footer and Bottom Margin. The Report Footer banner is used to show the summary or results of the report. This section presents aggregates, averages, or other important results.
The "Details" band is the section of the report where the data is displayed in detail. Using this tape, you can create a separate row for each record in the data source. The detail tape prints all records as long as the data is not filtered. It is usually the largest section of the report and represents the main content of the report.
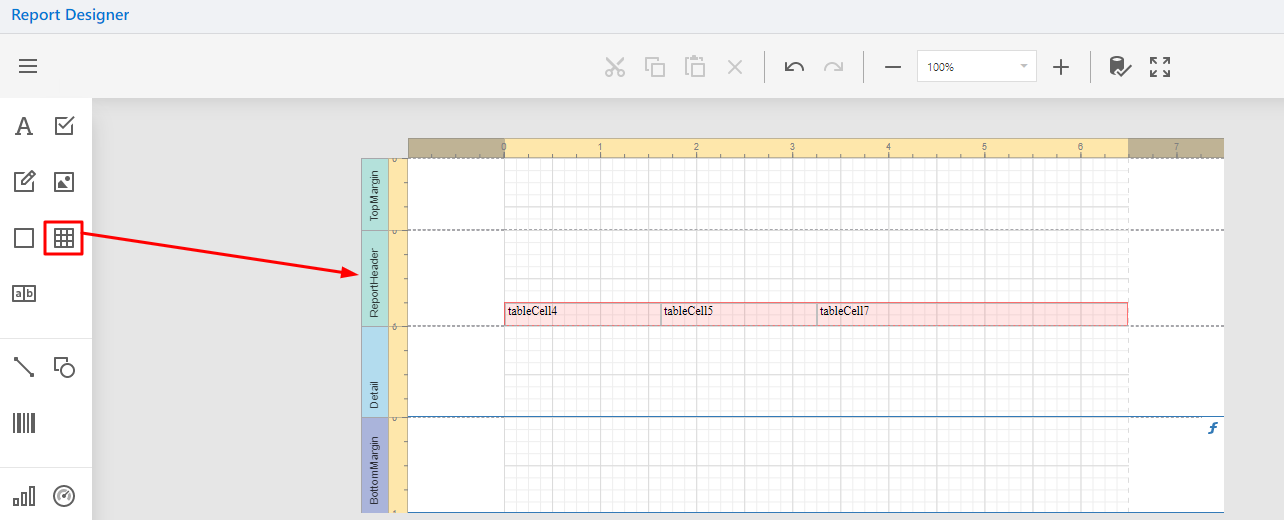 The table object from the toolbox is added onto "Report Designer" with the drag-and-drop method. Adding a table object occurs with 3 columns. The following steps are followed to customize the table object.
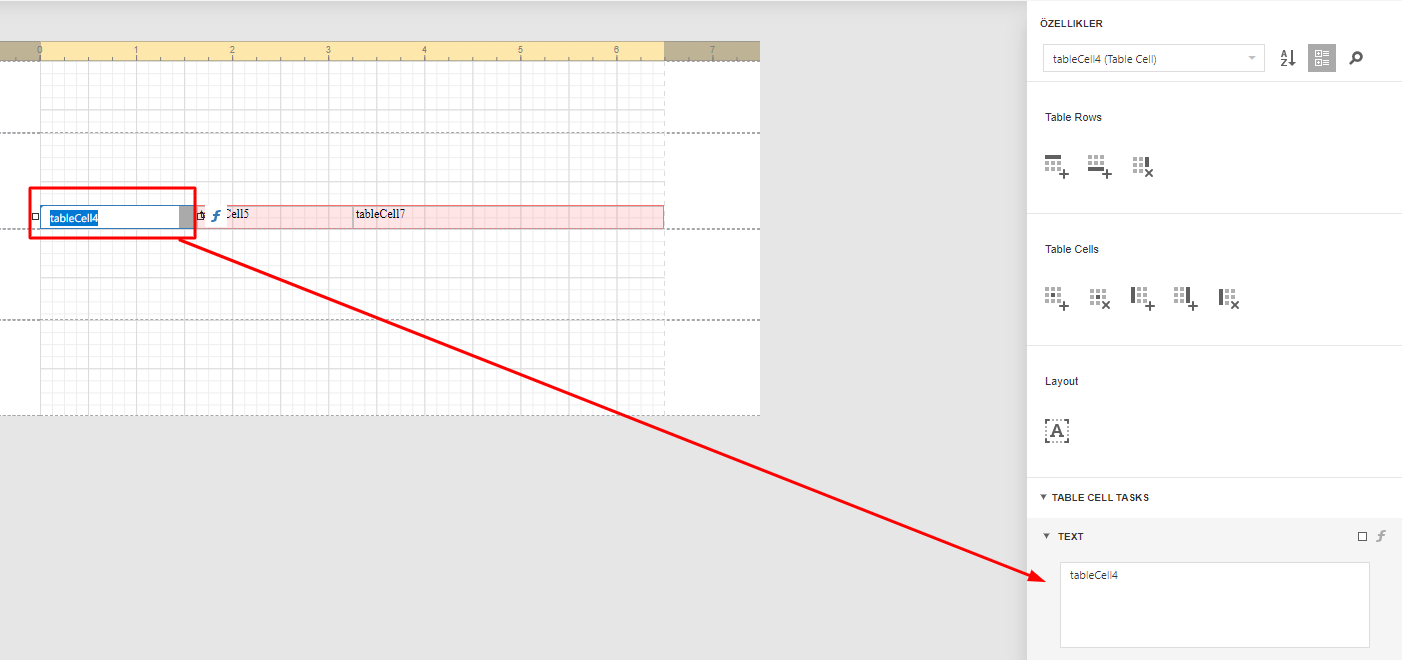 Double-click the column cell. Properties are displayed on the right side. In the "Text" field from the Properties window, enter the name to be given to the column. This process also applies to other cells.
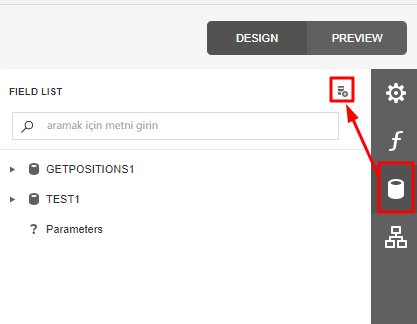 Click the store icon in the Properties window, select the source query desired to be used in the report from the Datasource list. This option includes the data sources that are defined in your project.
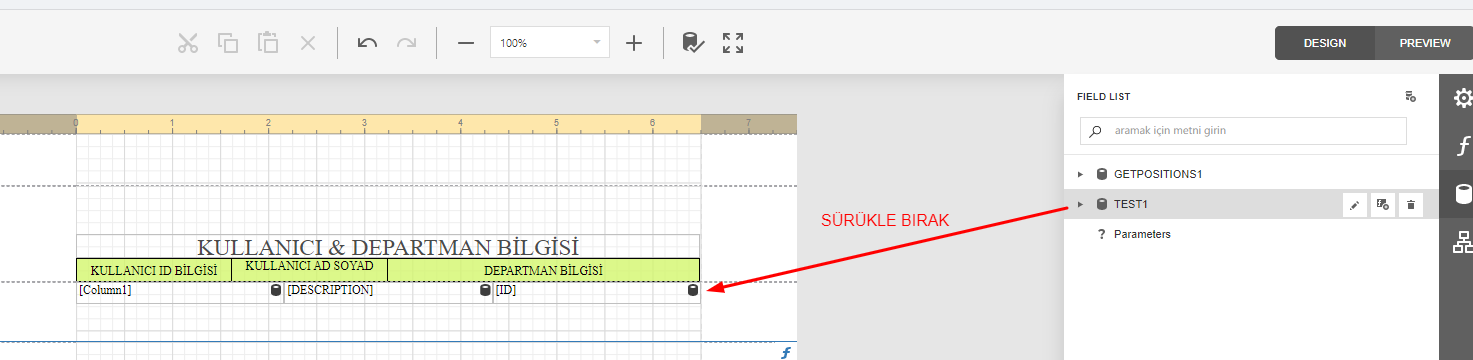 The data source is added to the Details area of Report Designer by drag-and-drop method.
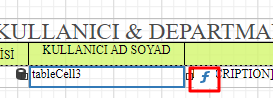 The cell is clicked and the 'f' icon on the side is selected to mark the value of the cell as in the bottom visual.
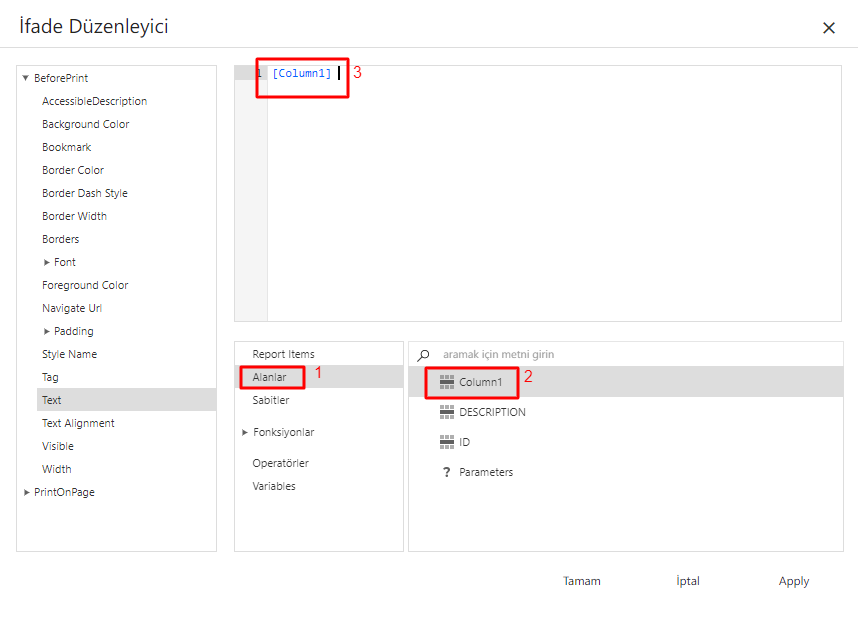 Under Report items
 > Fields, the fields from the DataSource are listed. This is where it is determined what data the marked cell will return.
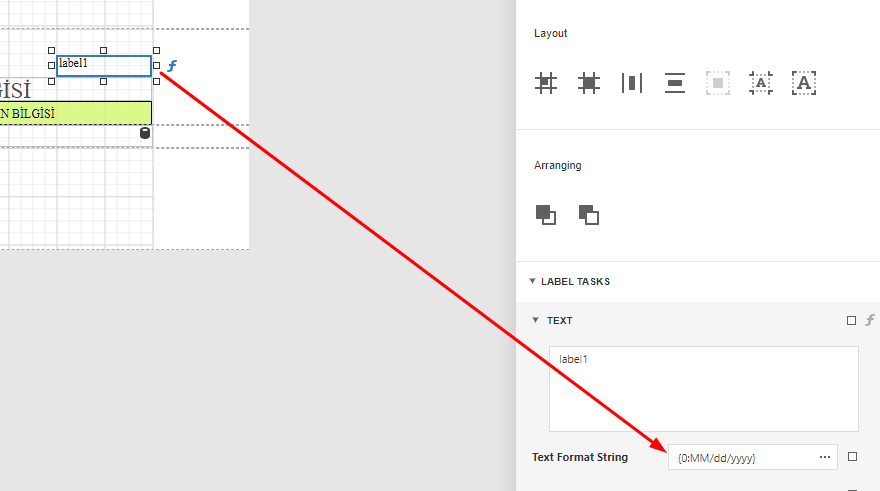 After you complete your report design, the text format is determined by adding a label to the Report Header field. This can be the title of your report or another text element, and can be customized to reflect the image you want. By clicking on the 'F' icon, you choose between different options to determine the date structure.
To save the changes, click on the menu lines located in the upper left corner, and then press the "Save" button. This ensures that you maintain the up-to-date design of your report and creates a saved version for you to use in case you want to access or share it again in the future.
After you complete your report design, the text format is determined by adding a label to the Report Header field. This can be the title of your report or another text element, and can be customized to reflect the image you want. By clicking on the 'F' icon, you choose between different options to determine the date structure.
To save the changes, click on the menu lines located in the upper left corner, and then press the "Save" button. This ensures that you maintain the up-to-date design of your report and creates a saved version for you to use in case you want to access or share it again in the future.
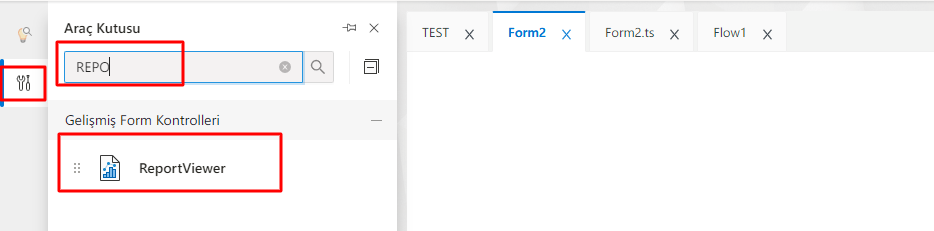 The form in which to display the report opens. The "ReportViewer" revision is added from within the toolbox.
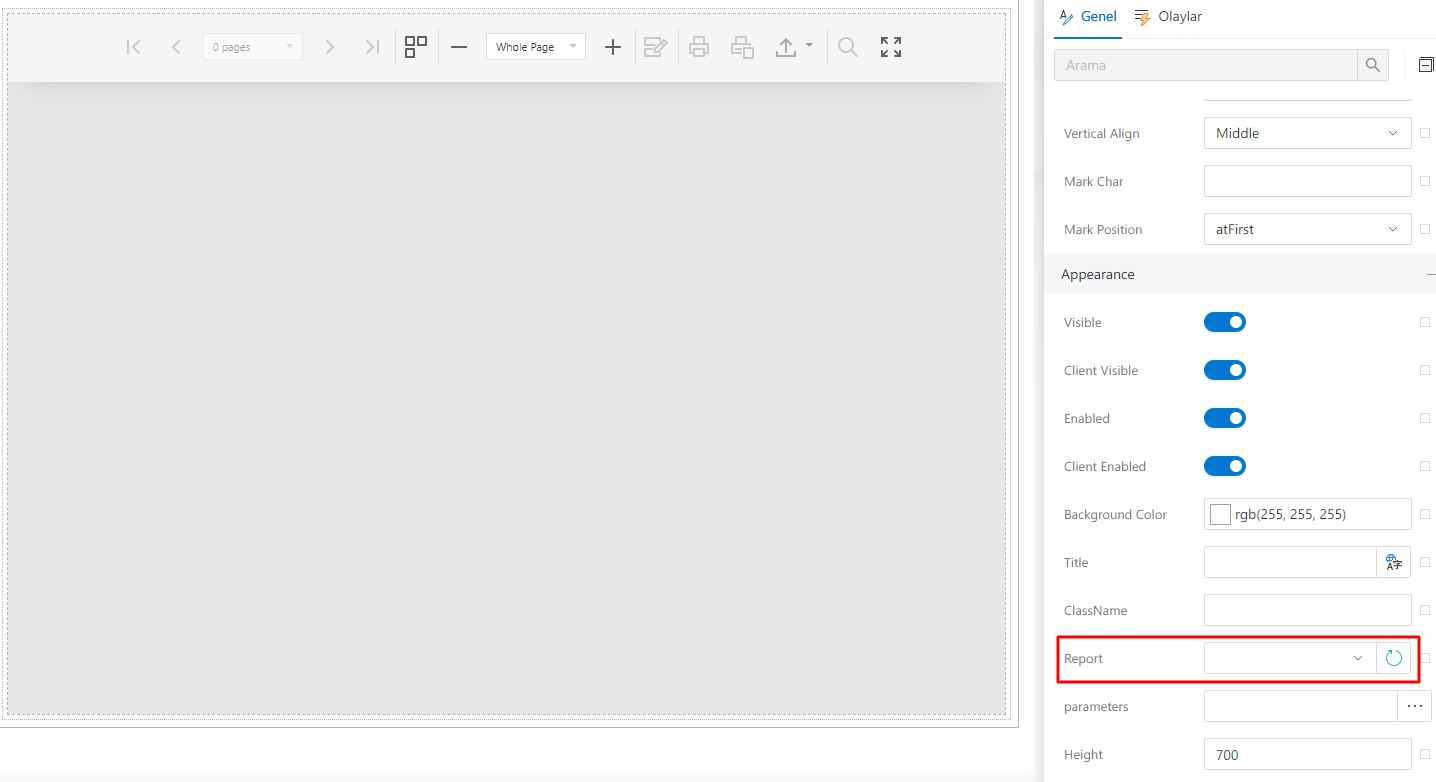 Double-click the object to access its properties. The Report to be displayed is selected by clicking on the Report field in the Properties window
 > Appearence. The project is published and added to the relevant breakdowns and ready to be presented to users.
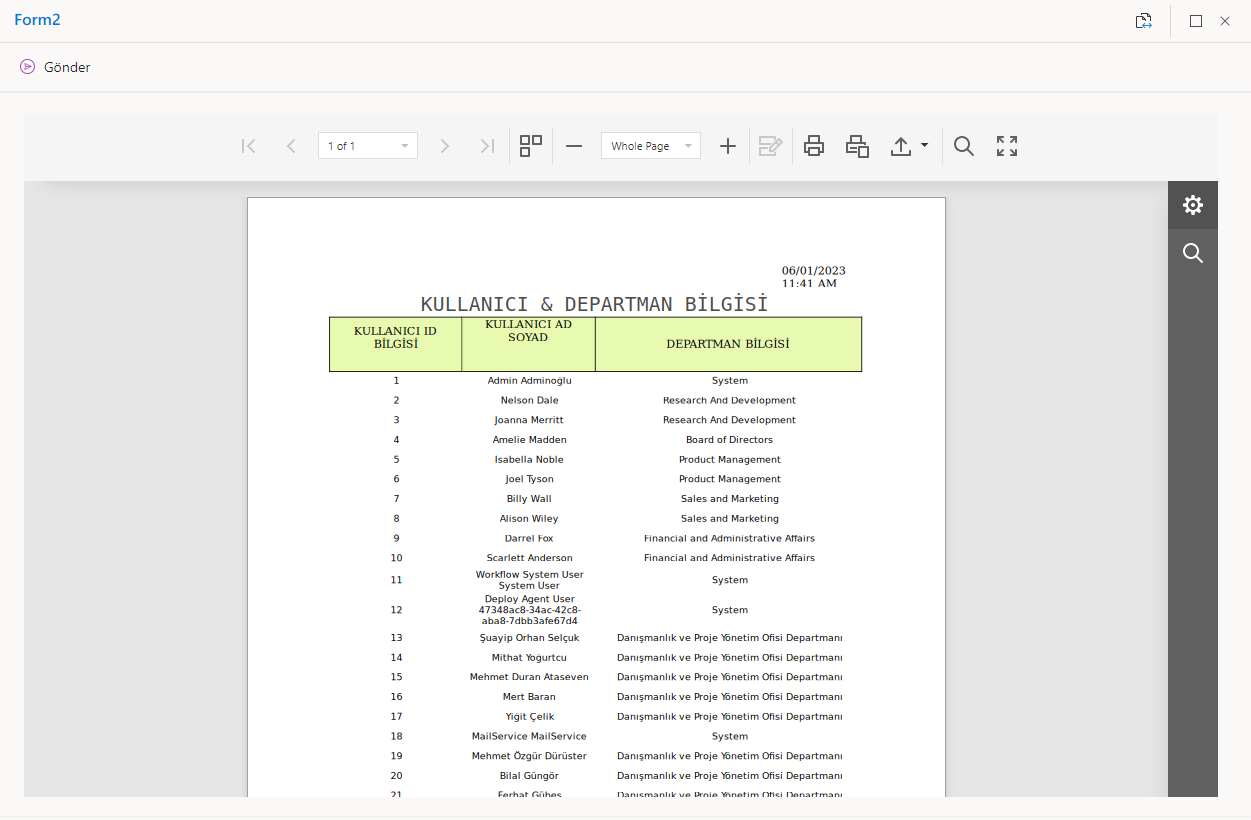
Form View
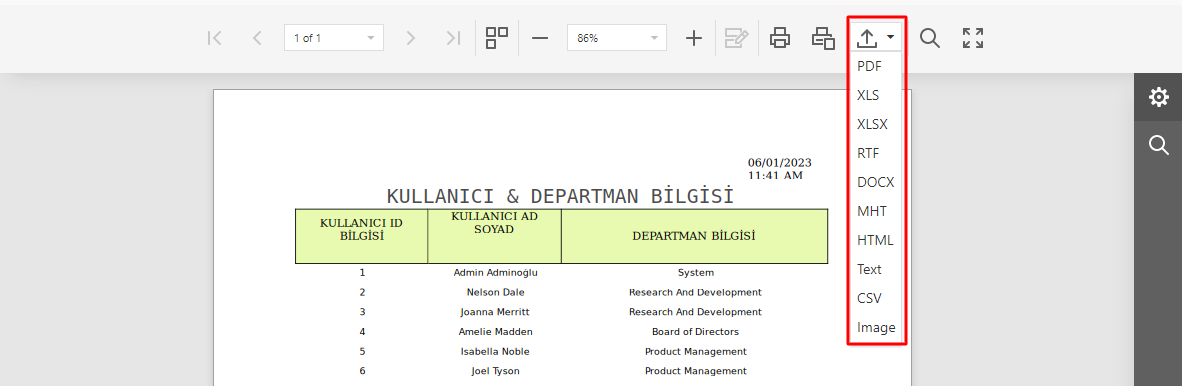
 More than one download option is listed on the object.
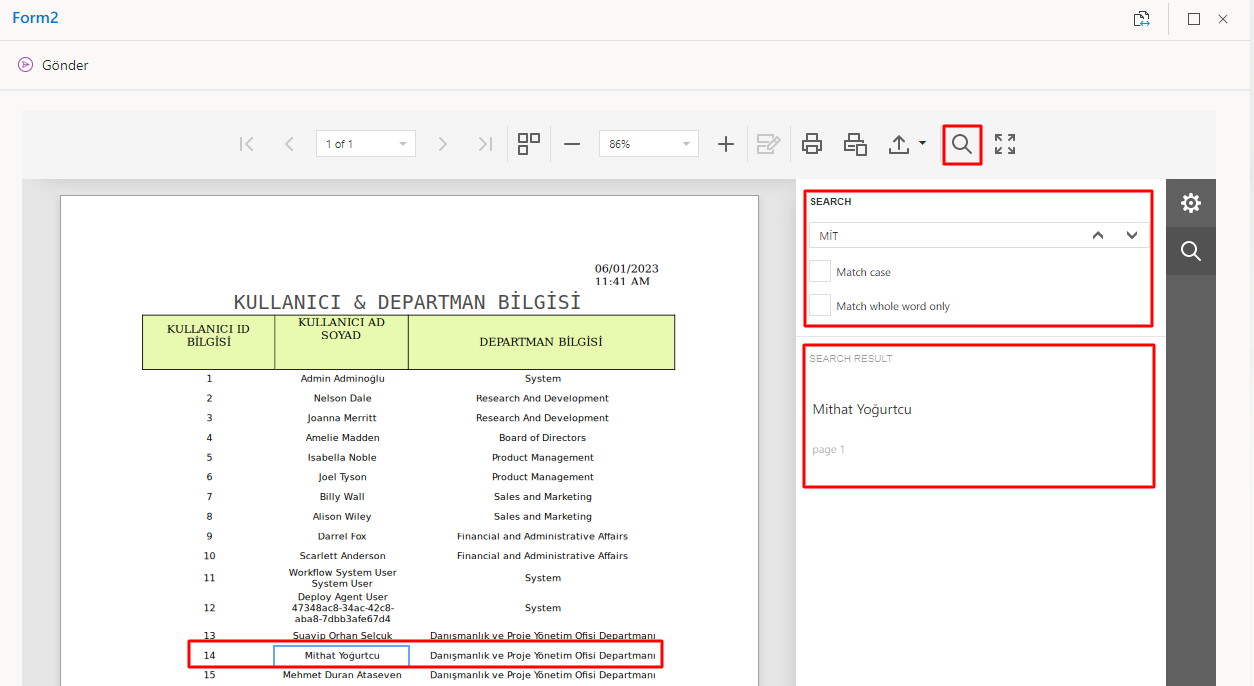 A search can be performed within the report. After clicking on the magnifying glass icon, the word to be searched is typed into the box. If matches exist under report and search, they will be listed in the "Search Result" field.