COLORING OF THE GRIFFIN ACCORDING TO THE INTERVALS ON THE DISPLAY SCREEN
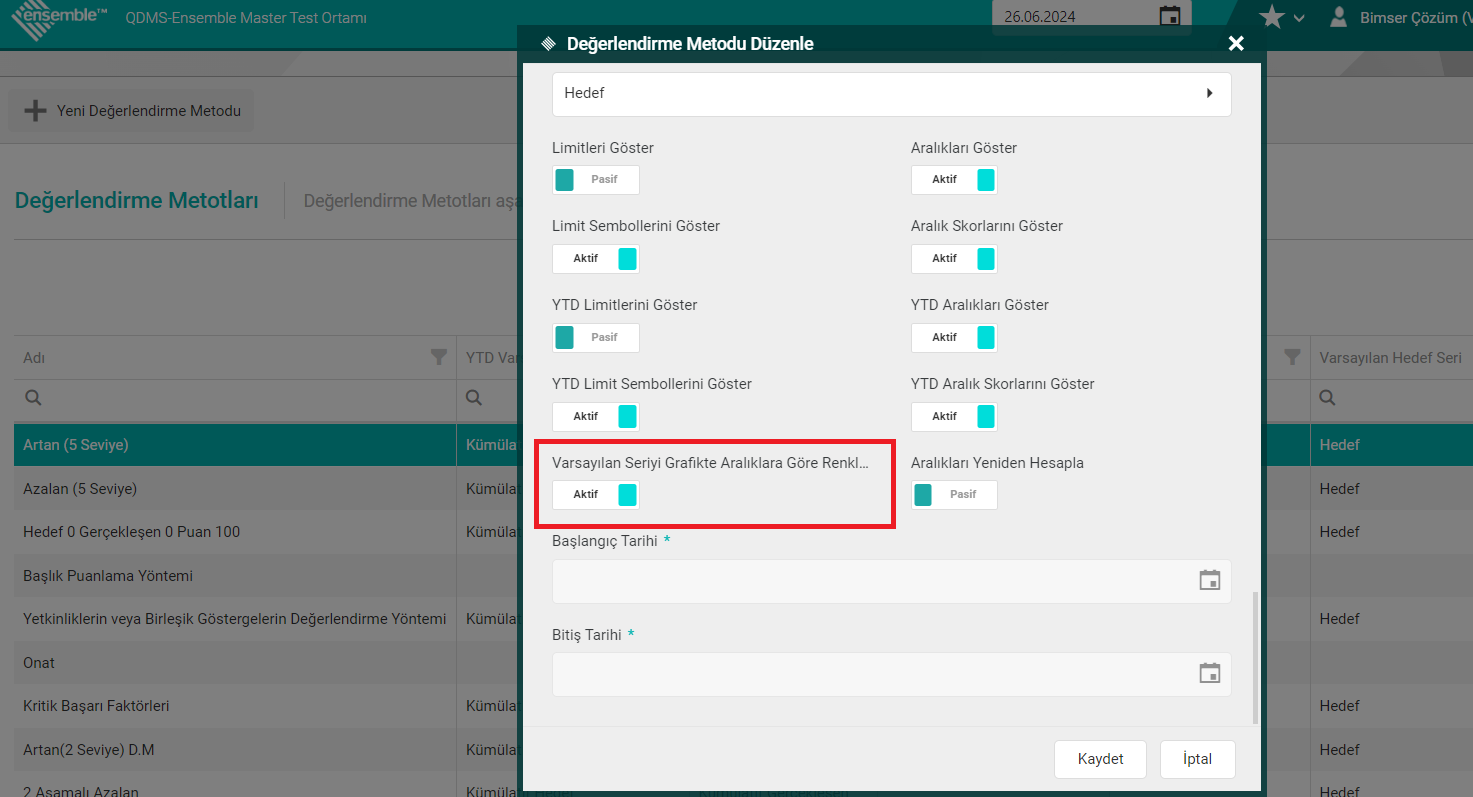
-Go to the Evaluation Methods and select the desired evaluation method and open the editing screen.
-On the screen that opens, the "Color the Default Series by Ranges in the Chart" option at the bottom is activated.
-Then, the desired indicator is opened from the "My Indicators" tab and in the chart display, the series on the chart It is seen that each of them is multiplexed according to the intervals it falls into, and it takes the color of the relevant range. Thus, the range in which each period falls is graphed It can be easily followed on it.
