Adding targets to assets, sections and consumables and target analysis
Through the asset management > definitions tab, asset targets, consumables targets and section targets are proceeded to the definition tabs for the definition to be targeted, respectively.

Ex: To add an asset target, the entity targets definition page opens and the month and year to set the target are checked on the pop-up page. Then, by selecting the asset to be targeted, information such as maintenance time, number of maintenance, cost, downtime, number of stops, mttr, mtbf are added to the asset, and then the target is saved from the top right.
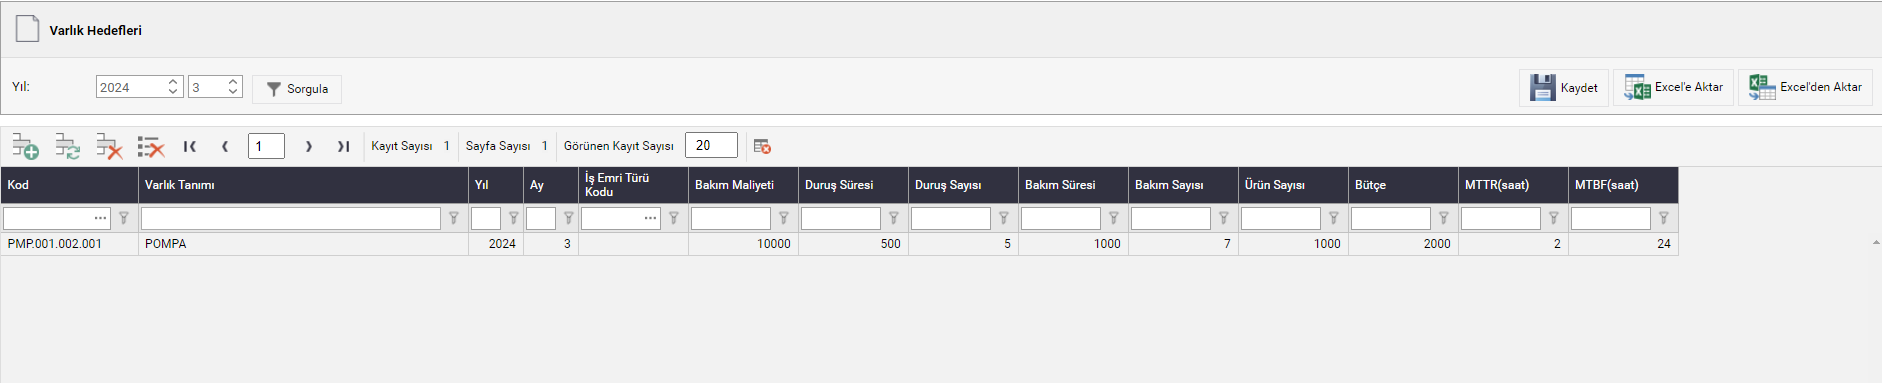
The added target can be added with the + icon in the left corner of the interface, or it can be added through an excel template by filling in the same information.
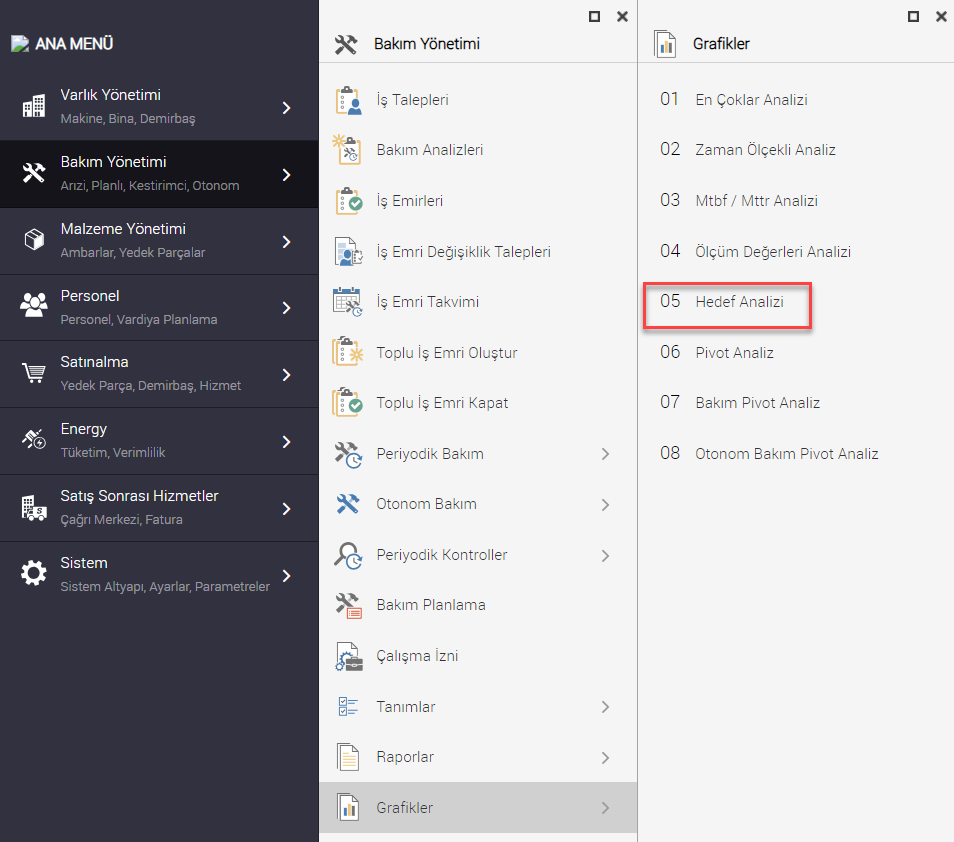
In order for us to track whether the added target has been achieved> the target analysis graph is looked at in the maintenance management graphs tab.
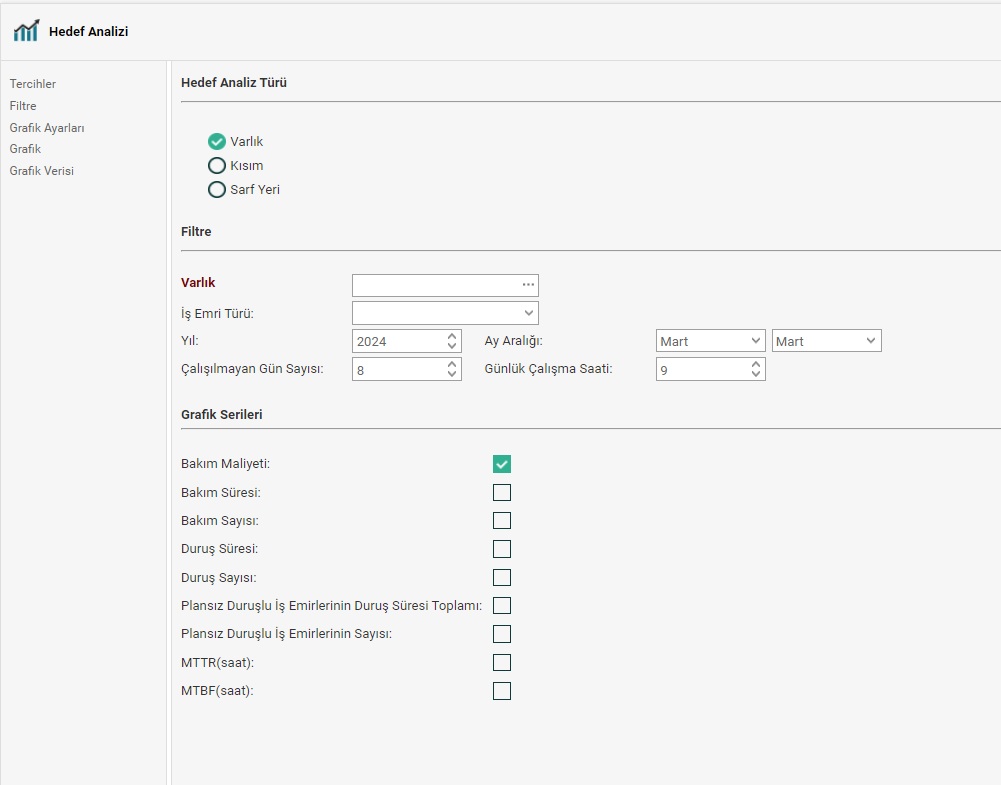
In the goal analysis preferences tab, we first need to determine the type of analysis of the goal you have set. Since we set a target on the entity in the example, we also specify the goal analysis type as an entity.
The target entity is selected from the filter field. The date information and the number of days not worked, as well as the number of working hours per day, are entered correctly. The titles that are desired to appear in the chart are also selected via the buttons below.
The desired filter can be given in the filter and chart settings area. From the chart settings area, adjustments such as the title of the chart, the display format of the data written on the horizontal and vertical axis are made.

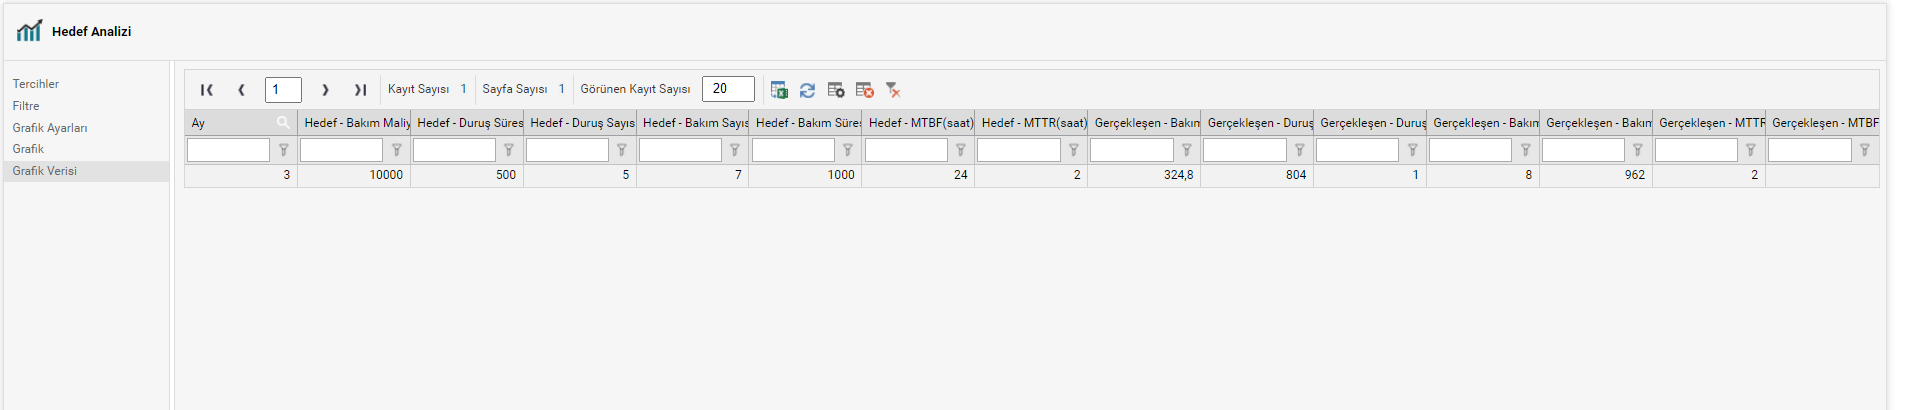
In the chart output, the upper right is the expression of what the chart colors mean. At the same time, the graphic can be output in different formats, and the visual structure of the intrigue can be changed to the desired type from the graphic type field.
Visual graphics can be printed, as well as the data set of the data reflected in the chart in excel format can be viewed and printed out via the data tab. Similarly, the work done for the asset target can be done from the relevant target definition pages for the consumable and part and output can be obtained on the same graph.